Soil Moisture Newsletter – Winter 2025
From Probes to Plans: How Soil Moisture Data is Shaping Smarter Farming
Soil Moisture Newsletter
This newsletter is designed to support the use of the Wimmera CMA’s soil moisture portal. In our first issue, we take a look at current soil moisture across the catchment, provide details of the latest seasonal outlooks, learn how to interpret soil moisture graphs and determine Plant Available Water (PAW).
Thanks for taking part in our portal user survey
Last year, we asked for your feedback on how we could improve the soil moisture portal. We’ve used your feedback to make some upgrades to the data portal. Another recommendation was to publish a newsletter to share information on how to make the most of the portal. We’ll publish 3 editions of the newsletter this year, with another scheduled for mid-growing season, and a final newsletter towards the end of the growing season.
Climate outlook – Winter 2025
Following a disappointingly dry autumn, winter is also forecast to be warmer and drier than average across the Wimmera. The region has yet to receive the rainfall needed to mark an autumn break, and soil moisture levels remain critically low, especially in the west and north.
Rainfall
The Bureau of Meteorology forecasts a 60–70% chance of below-average rainfall through winter. A potential negative Indian Ocean Dipole could bring relief later in winter, but forecast confidence is low. ENSO remains neutral.
Soil moisture
A scan of soil moisture probes across the Wimmera CMA Soil Moisture and Weather Station Network showed low soil moisture in the surface 20-70cm zone as of 20 May 2025, with variance due to localised rain events or fallow management. This means that good crop establishment and pasture growth will be dependent upon rain over the coming weeks.
Temperature
The BOM’s temperature outlook shows a 70–80% chance of above-average maximum and minimum temperatures, with sea surface temperatures off southern Australia 2–3°C above normal. Fewer frost events are likely, but increased warmth could limit chill hours and raise evapotranspiration.
Climate drivers
ENSO and the Southern Annular Mode are both neutral, with high-pressure systems dominating, suppressing rain-bearing fronts. A shift to a negative IOD remains possible mid-winter, although its influence is uncertain.
Further information, links and Relevant Information
- Wimmera CMA Soil Moisture and Weather Station Network
- The Fast Break
- BOM Climate Outlooks
- Soil Moisture Monitoring
How to interpret soil moisture graphs
Dr Cassandra Schefe, AgriSci Pty Ltd
Download a copy of the Fact Sheet:
Interpreting soil moisture graphs and calculating Plant Available Water (PAW) PDF DOCX
- An understanding of current plant available water contents (PAW), aligned with weather forecasts, can be helpful in making management decisions.
- Soil moisture probes are a valuable management tool as they can be used to understand the total soil moisture content, the proportion of that moisture which is available to plants, and how well the plant roots are extracting moisture from each depth.
- Accurate interpretation of soil moisture graphs requires an understanding of the soil type, including any physical and chemical constraints that may restrict root and/or water movement to depth.
The key reason why we install soil moisture probes is to quantify the amount of stored water in the soil that may be accessed by plants. However, sometimes when we look at soil moisture graphs, they can be a bit overwhelming with all the different data lines. (Note, for this article the focus is on the 20-70cm depth zones for illustration purposes, however the deeper probes will also show the same characteristics.)
The variation in the amount of fluctuation in the soil moisture data line is due to differences in clay content. Water can infiltrate faster through a sandy soil than a clay soil, with most of the water being stored in a sandy soil able to be extracted for plant use. This means that a soil moisture data line of a sandy soil will fluctuate quickly.
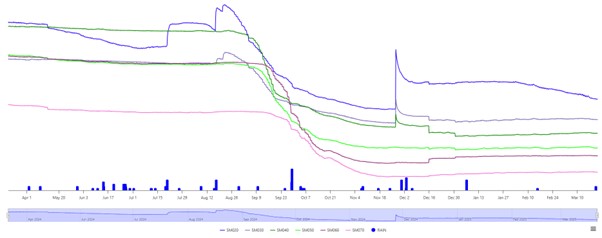
An example of this is the Goroke site (Figure 1), which has a surface soil Cation Exchange Capacity (CEC) of 4.9 meq/100g, which reflects low clay content, and a similar pattern of relative soil moisture for all probes in the 20-70cm depth layers. Scale is important to note, as the stacked graphs can be deceptive. At April 1 2024, all layers had between 60-75mm moisture, which decreased to between 35-55mm by March 10, 2025. It is the relative change within a line/depth, that is important to note, not the positioning of the lines on the graph.
The dark blue line (SM020) shows high fluctuation of soil moisture, with some evaporation pre sowing, and then active extraction of moisture from sowing onwards. Evapotranspiration (ET) is shown by the slight ‘wiggle’ of the blue line in April 2024 (evaporation), with stronger draw down or ‘wiggle’ from sowing through to mid-July due to the diurnal (day/night) flux of plant transpiration.
Following the various colours on Figure 1, it is easy to pick up that roots started to actively extract from the 30cm depth in mid-August, followed closely by the other depth layers in a cascading pattern, with root extraction from the 70cm zone being seen by mid-September. While there were significant rain events in late September, this didn’t result in a large water peak as it was quickly utilised, just reducing the rate of water extraction. As the wheat plants reached maturity in November and roots senesced, the lines flattened out. A rain event in December recharged the surface 20-40cm layers, with their moisture content decreasing through December (shown by down steps) as the deep layers recharged (shown by up steps).
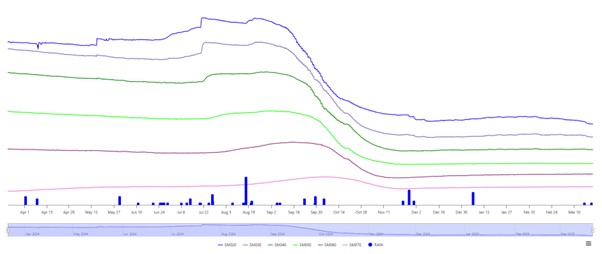
In comparison, water can only slowly infiltrate through a clay soil, as the complex clay structures have smaller pathways for water flow than a sandy soil. However, clay soils have a greater water-holding capacity than a sandy soil, with greater amounts of water being stored, or absorbed in all the small pore spaces around the clay particles. The challenge with clay soils is that while they can hold a lot of water, most of this water is only slowly available for plant use, with a portion being unavailable, due to the high affinity of the clay particles for this water. This explains why a soil moisture data line of a clay soil will only change slowly, with a slower, and lower rate of extraction than a sandy soil.
An example of a heavy clay soil is the Natimuk 3 site (Figure 2). This soil has a surface CEC value of 33 meq/100g, reflecting a clay soil, likely a cracking clay soil, with the decreasing range of fluctuation of each soil moisture probe indicating increasing clay content with depth.
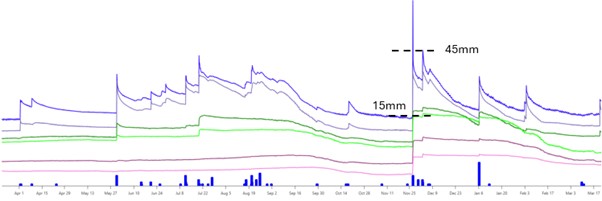
While Figures 1 and 2 are extremes, it is quite common to for soils to have a lighter surface soil, above a heavier clay subsoil, known as a duplex soil, and likely to reflect more of the red-brown earths in the Wimmera. An example is Figure 3, the Deep Lead pasture site.
The soil moisture probe data in Figure 3 shows large fluctuations in soil moisture down to about 40cm, with these fluctuations smoothing out at lower depths, indicating a sharp increase in soil texture about the 40cm depth, with increasing clay content below that. The impact of a pasture phase can be easily seen with the strong drawdown of moisture all year through all depths, albeit with less range of fluctuation at deeper depths as the clay content increases.
The Deep Lead pasture site (Figure 3) also provides an example of a common anomaly with soil moisture probes, which is preferential flow down the side of the tube. This is dramatically shown by a large spike in soil moisture on November 26, 2024, due to a high intensity rain event on dry soil, resulting in a simultaneous increase in soil moisture at all depths – not the gradual cascading of soil water down the profile over time which would be expected. This caused a reset in soil moisture at all depths at a higher level, the extent of which may or may not be ‘real’, especially at the lower depths.
The difference in the water stored vs extractable soil water is explained by the Plant-Available Water (PAW) value, which is a calculated value unique to each soil type. The PAW value is described as:
Drained Upper Limit – the amount of water stored in the soil after free draining of excess water, otherwise known as Field Capacity minus the Crop Lower Limit – the point where plants cannot extract any further water from the soil, otherwise known as Permanent Wilting Point.
On a stacked soil moisture graph, this can be calculated by identifying the highest point on each data line on the graph (excluding sharp peaks that indicate preferential flow down the side of the probe), and the lowest point on each line on the graph, and then calculating the difference.
An example is shown for the 20cm moisture probe for the Deep Lead site (Figure 3), where the dotted lines show the upper and lower limits as 45mm and 15mm. The difference between these two values is 30 mm, which is the PAW value for that depth. Note, if the probe has not been in the ground long enough to be subjected to the minimum (driest) and maximum (wettest) for each depth, do these calculations with caution.
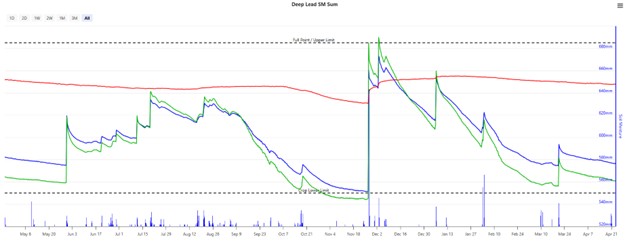
The Summed Soil Moisture Graph can be used to calculate the size of the PAW bucket through the whole profile. However, a caveat with this; only calculate to the depth of root exploration, confirmed through observed extraction of soil moisture by roots shown through declining soil moisture data lines over the growing season. For example, if root depth is limited due to soil constraints at 60cm (eg Boron toxicity), then estimation of PAW to the full depth (130cm) would give a false prediction of available water.
In the Deep Lead Summed Soil Moisture Graph (Figure 4), the green line is the sum of all the soil moisture values for the 20 – 70cm depth probes (SM Sum 20-70cm). The red line is the sum of the lower 80-130cm probes (SM Sum 80-130cm) and the blue line is the sum of all probes 20-130cm (SM Sum 20-130cm). The dotted lines are an overlay of the Upper and Lower limits for the PAW for the 20-130cm depth, and the axis on the right-hand side is the soil moisture content, aligned with the 20-130cm depth (blue line). In this instance, as the red line (deep probes) is showing depletion in soil moisture in alignment with the green line (shallow probes) it is likely that roots are extracting water to depth, and so it is appropriate to calculate the PAW for the whole 20-130cm zone. While the Upper and Lower limits demonstrate the total potential bucket as 685mm – 550mm = 135mm, the actual plant available water at 21 April 2025 is 576mm – 550mm = 26mm. This is calculated from the blue line value minus the Lower limit.
An understanding of current soil moisture status, especially PAW, can assist in de-risking management decisions. For example if soil moisture levels are depleted at sowing, and weather forecasts are showing minimal rain, a more conservative agronomy strategy may be adopted. This will be discussed further in the next instalment of the newsletter.
Case study – Tapping into the soil moisture probe portal
See case study at: Digging Deeper – Soil Moisture Data is Transforming Farming in the Wimmera
Learn more and subscribe
Wimmera CMA provides regular updates and data interpretation to portal account holders via newsletters, case studies and webinars. We welcome individuals and groups to get in touch for additional support.
- Email wcma@wcma.vic.gov.au
- Phone (03) 5382 1544
- Or complete our online Newsletter Signup form


